I first wrote xStats in May and June of 2015. When vertical angle became available in 2016 I again sat down and rewrote everything from scratch in order to include vertical and horizontal launch angle. I used this source code from 2016 through the 2017 season, implementing regular updates. I averaged an update every two to three weeks during the course of those two seasons. At the end of the 2017 I decided my source code was a mess and it was time for a total rewrite.
Several weeks later, here we are. xStats has been rewritten entirely from scratch. I do not believe a single line of code survived the update. As a result, there may be a few features you enjoyed which are no longer present. Those features will need to be rebuilt from scratch, which may take some time. This includes the projection system, which is currently a bit of a mess. That may take a few more weeks to complete.
There are a few new features. Behind the scenes, xStats has been built to make custom searches far easier and faster. So, for example, if you'd like to know stats between two dates you could find them with minimal effort. Sorry to get your hopes up, but that isn't available publicly.. yet. It will cost money to host that data, and might require some sort of crowd funding.
Anywho, there are other new features which you can start using today that I am excited to roll out. I suppose this is a good time to introduce the new data sheets. Let's start with the batters.

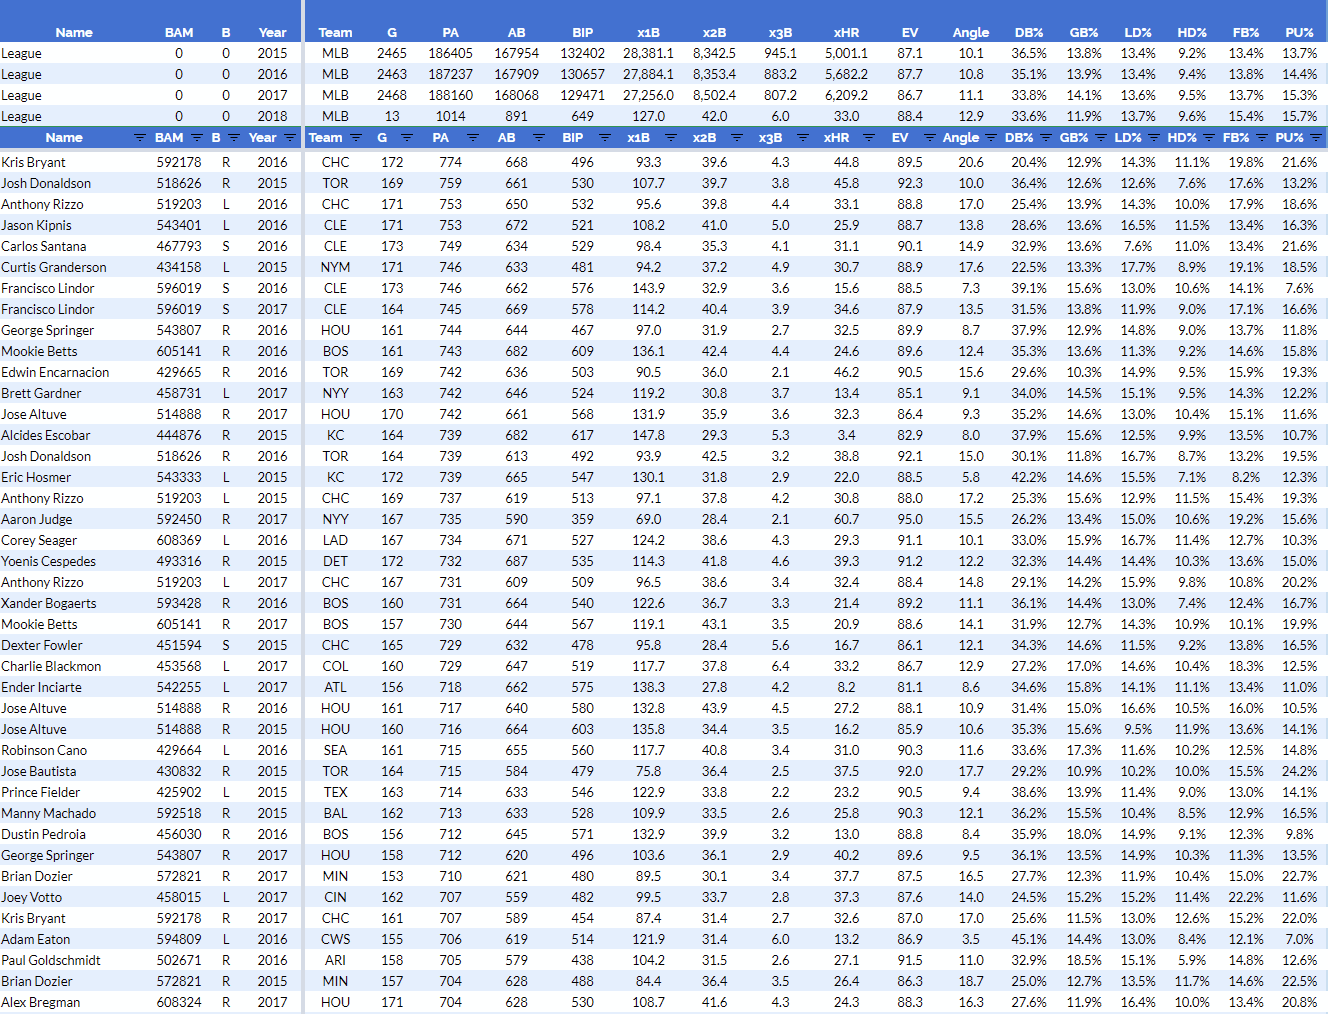
This image shows you the first thing you should see when you open the batters stats sheet. You can read the titles of the columns and see these are pretty basic, entry level stats. Yes, the team titles are still broken/unreliable. I haven't had time to fix that.
You'll see three colors, which remain consistent throughout. The blue columns depict stats that do not change whether you're looking at standard or xStats. The green columns show 'regular' stats, and yellow shows 'xStats.' So, for example, strikeouts and walks are in blue, home runs are in green, and expected home runs are in yellow. Easy, right?

Next you'll see the slash line items. Batting average, expected batting average, etc. I want to bring your attention to three stats on the right here.
xOBA+: This stat is equivalent to the wRC+ stat, using xOBA instead of wOBA.
OUTs: This is a complete offensive metric, and counts batted ball quality, walks, and strikeouts per plate appearance. In some ways it is similar to wOBA and xOBA, but it uses very different input. This stat has been modified to have league average set to 0. Anything above zero is above average, and everything below 0 is below average.
xRAD: This stat shows how many runs a player adds to his team's offense. In some ways it is similar to wRC, but it uses vastly different input. It is largely based on the OUTs stat, and it is weighted by plate appearances and team plate appearances.

Finally, there are at a glance launch angle and exit velocity information. You can use these to sort types of batters when analyzing other qualities.
Alright, so that is the batters sheet. There are versus righties and versus lefties splits pages, but they are set up identically. Next, let's look at the BIP sheet.
On the left hand side of the BIP sheet you will see season total stats for several basic categories. These are the same numbers you will see on the batter page, but they are here to help you sort and group players.

For each launch angle category you will see the number of balls in play, the average exit velocity, and average launch angle. In addition to that, you will see expected singles, doubles, triples, and home runs. So, for example, Kris Bryant had 22.9 x1B and 2.7 x2B on his Dribble Balls in 2016. He hit 101 such balls, so he had a .253 xAVG, .280 xSLG and .232 xOBAcon on those batted balls. Which actually isn't too bad for Dribble Balls, which averaged .187 xAVG, .202 xSLG, .170 xOBAcon that season.
Like I said before, this data is available for all six launch angle types. I color coded these launch angle types with respect to their overall batted ball value. The HD are red, FB are orange, LD yellow, GB green, DB blue, and PU purple. They color the rainbow from red = good to purple = bad. Easy, right? Unless you're color blind. Sorry. But hopefully you can still differentiate the columns easily enough. There are identical sheets for the vR and vL splits.
Let's move on to the pitcher sheet.

Like the batters sheet, there is a large blue area representing the stats that do not change with regard to 'regular' and 'xStats.' Notice that there are four different ERA scalers in addition to ERA. FIP, scFIP, kwFIP, and bbFIP.
“FIP: [ 13 x HR + 3 x BB - 2 x SO ] / IP + C
scFIP: [ 13 x xHR + 3 x BB - 2 x ( SO + PH ) ] / IP + C
kwFIP: -11 x [ ( SO - BB ) / PA ] + C
bbFIP: 11 x OUTs + C”
As you can see from the formulas above, this is standard FIP. scFIP is a twist on xFIP. kwFIP is a standardized stat, but you may not be familiar with it. bbFIP is a twist on kwFIP (it flips from -11 to 11 in order to satisfy the requirement to make a higher OUTs score represent superior talent). Between these four ERA scalers, you should get a pretty good view of a pitcher's performance.

Next we have all of the batted ball data and slash line items you'd expect. Expected hits versus real hits. Expected slash line versus real slash line. Pretty basic, and effectively identical to the batters sheet.

Finally, the pitchers sheet ends with a solid blue block of stats. First, you have K%, BB%, and BB-K% which are pretty basic numbers. Then VH% and PH%, which depict value hits and poor hits respectively. You can look at the glossary for more information about them. All of these stats are measured per batter faced, so you can add them. So, for example, in 2015 Kershaw had 34% strikeouts and 19.8% poor hits. That means 53.8% of the batters he faced either struck out or hit a batted ball so weak it was effectively an automatic out.
The pitchers have vR and vL sheets which are identical to this. They also have BIP sheets which are identical to those created for the batters.
Please this in mind: my database currently does not have actual vR and vL innings pitched totals or earned runs totals. I am using a bit of a hack to 'estimate' the IP totals, so there are IP totals available for the splits. Just keep in mind that they are estimates and not true numbers. They should be close, though. Most pitchers should be within 3-4 IP. Many should be within 1 IP.